Overview
The importance of digital filters is well established. Digital filters, and more generally digital signal processing (DSP) algorithms, are classified as discrete-time systems. They are commonly implemented on a general purpose computer, on a dedicated DSP chip, or in a Field Programmable Gate Array (FPGA) chip. Because of their well known advantages, digital filters are often replacing classical analog filters. In this application note, we introduce a new digital filter design and analysis tool with which developers can work within a graphical development environment to interactively design, analyze, and implement digital filters. Highlights of the software include the ability to work with live signals to facilitate real-world filter testing and the ability to automatically generate LabVIEW and ANSI C code for targeting a DSP, an FPGA, or other embedded systems.
Table of Contents
Digital Filter Design Process
Digital filters are used in a wide variety of signal processing applications, such as spectrum analysis, digital image processing, and pattern recognition. Digital filters eliminate a number of problems associated with their classical analog counterparts and thus are preferably used in place of analog filters. Digital filters belong to the class of discrete-time LTI (linear time invariant) systems, which are characterized by the properties of causality, recursibility, and stability. They can be characterized in the time domain by their unit/impulse response, and in the transform domain by their transfer function. Obviously, the unit-impulse response sequence of a causal LTI system could be of either finite or infinite duration and this property determines their classification into either finite impulse response (FIR) or infinite impulse response (IIR) system. To illustrate this, we consider the most general case of a discrete-time LTI system with the input sequence denoted by x(kT) and the resulting output sequence y(kT). As it can be seen from Equation 1, if for at least one n, av≠ 0, the corresponding system is recursive; its impulse response is of infinite duration (IIR system). If av=0, for all n, the corresponding system is nonrecursive (FIR system); its impulse response is of finite duration and the transfer function H(z) is a polynomial in z–1. Commonly,
bµ is called the µth forward filter coefficient and av the nth feedback or reverse filter coefficient. For a detailed discussion, refer to standard signal processing textbooks such as Reference 1.
Equation 1

Common Steps in the Digital Filter Design Process
- Determine the desired response. The desired response is normally specified in the frequency domain in terms of the desired magnitude response and/or the desired phase response
- Select a class of filters (for example, linear-phase FIR filters or IIR filters) to approximate the desired response
- Select the best member in the filter class
- Analyze the filter performance to determine whether the filter satisfies all the given criteria
- Implement the best filter using a general-purpose computer, a DSP, or in an FPGA
NI LabVIEW Digital Filter Design Toolkit
The NI LabVIEW Digital Filter Design Toolkit (DFDT) is a complete filter design and analysis software that you can use to design digital filters to meet required filter specifications. It is an add-on that installs into LabVIEW (References 2 and 3), a software development environment that employs a graphical programming language that is both easy to learn and extensible. With the DFDT, users work within the LabVIEW development environment to design, analyze, and implement a variety of IIR and FIR filters. Working within the LabVIEW environment has a number of advantages, among them the ability to do filter testing with simulated signals (generated algorithmically) or live signals (such as those acquired using a standard National Instruments data acquisition device or a sound card). You can view the time waveforms or the spectra of both the input signal and the filtered output signal to show how the current design performs on real-world signals. Examining how the filter performs on a live signal is useful to validate the design before you deploy it in a custom LabVIEW application, or perhaps on an embedded DSP or FPGA.
Related Links
Filter Design Options
The DFDT includes both programmatic and interactive tools for filter design. Using the programmatic tools, you can easily sweep design parameters and perform other automated tasks. The interactive tools are excellent teaching tools in that they provide immediate feedback after specifying desired filter characteristics.
Two interactive design tools are available – one for classical filter design and the other for design through placement of poles and zeros. Both tools are LabVIEW Express VIs, which means that the results are immediately available for use within the LabVIEW graphical development environment.
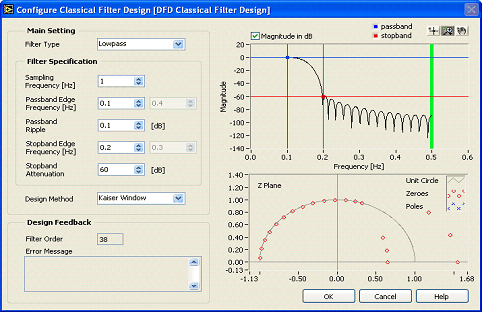
Figure 1. With the Classical Design Express VI, users can specify filters by typing in passband/stopband frequencies and other parameters. Design results are shown immediately as magnitude response and pole-zero plots.
Using the Classical Design Express VI (Figure 1), you can design a variety of filter types by adjusting the filter specifications by entering numbers or by changing the passband and stopband cursors in the magnitude vs frequency graph in the same panel. As the cursors move, the pole-zero plot and the text-based interface update dynamically to set the values for the desired filter. The interface supports FIR/IIR filter types including lowpass, highpass, bandpass, and bandstop. For FIR, design methods include Kaiser window, the Dolph-Chebyshev window, and the equiripple. IIR design methods include elliptic, Chebyshev, inverse Chebyshev, and Butterworth. 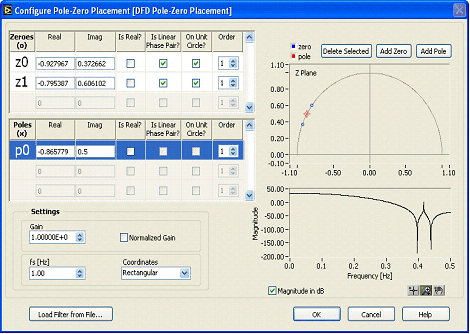
Figure 2. With the Pole-Zero Placement Express VI, you can design a filter by placing poles and/or zeros directly on the complex plane. The results of the design appear immediately as the magnitude response.
A second interactive design option is the Pole-Zero Placement Express VI (Figure 2). With this tool, you can interactively place and move poles and zeroes on the z-plane. To do so, you can enter complex value coordinates to specify exact values or click on a graph of the complex half plane to move or place them with the mouse. The magnitude response of the resulting filter updates immediately as you place or move poles/zeroes.
A Design Example
As an example, we will consider the design of an IIR lowpass filter with the specifications shown in Table 1.
Specification | Value |
Filter type | Lowpass |
Sampling frequency | 2 kHz |
Passband edge | 400 Hz |
Passband ripple | 0.1 |
Stopband edge | 500 Hz |
Stopband attenuation | 0.1 |
Table 1. Desired Filter Parameters for This Design Example
To interactively specify this design, the parameters are entered in the classical filter design Express VI dialog (Figure 3). Initially, with the design method set to elliptic, these parameters require a 3rd-order design.
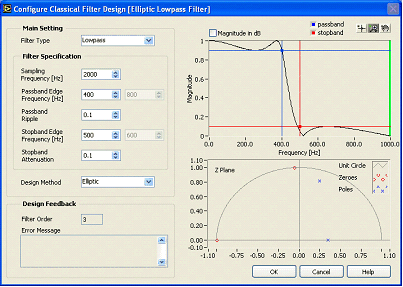
Figure 3. The desired filter parameters can be entered directly on the user interface of the Classical Filter Design Express VI.
We can now select other designs and get an immediate feel for the required filter order as well as the actual filter shape. With the previous specifications, the Butterworth filter requires 10th-order, the Chebyshev and inverse Chebyshev require 5th-order, and the elliptic filter requires only a 3rd-order IIR filter.
After initially specifying a filter through the Express VI interface, the resulting design can be further analyzed to show other filter characteristics such as the impulse response, step response, group delay, and phase delay. To view these and many other characteristics, you can feed your design into one or more filter analysis tools that are installed by the DFDT. Figure 4 shows graphs of the results of such analysis.
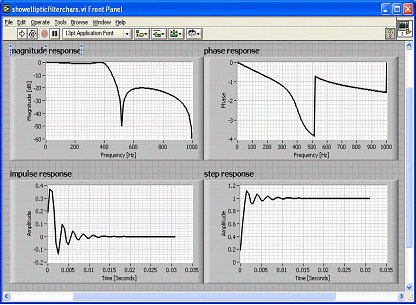
Figure 4. After specifying a design, you can plot common analysis such as magnitude response, phase response, impulse response, and step response.
The filter coefficients that are the result of the design are directly available in forms such as direct form I, as the forward (bµ) and reverse (av) filter coefficients from Equation 1, and 2nd-order cascade form.
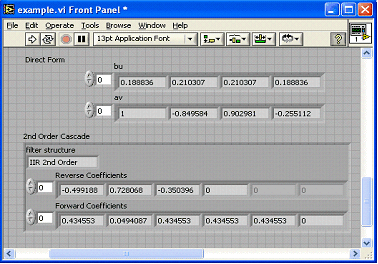
Once we have the filter designed, we have several alternatives for testing the design. For one, we can apply it to a test signal such as a computer-generated 50 Hz, 1 Vpp sine with noise (Figure 5).
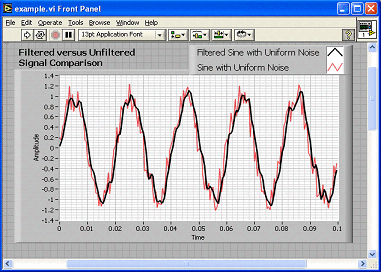
Figure 5. A plot of the filtered versus unfiltered test signals shows the action of the filter on a test signal.
Other alternatives would involve checking the design by applying it to a real-world signal. In these cases, the filter can be applied by either the PC or by an embedded target such as an FPGA or a DSP. For PC-based filter validation, you can acquire a live signal by using a sound card or a National Instruments data acquisition device. The acquired data then passes through the currently designed filter, and analysis such as plots of the input and output waveforms and spectra can be generated.
The DFDT includes automatic code generation tools that can assist with fixed-point filter validation and deployment for an FPGA or DSP. To target an FPGA, the DFDT can generate integer LabVIEW code or single-cycle timed loop LabVIEW code that can be used with LabVIEW/FPGA to directly target embedded FPGA targets such as those found on National Instruments RIO acquisition/signal generation hardware for the PCI and PXI platforms. For fixed-point DSP deployment, the DFDT can generate ANSI C code that can be compiled and deployed using vendor-specific DSP development tools.
Summary
Digital filter design and implementation consist of several interacting steps and call for efficient design and simulation tools. To facilitate this, National Instruments has developed the graphical design and analysis tools in the the LabVIEW Digital Filter Design Toolkit. The graphical user interface greatly simplifies the specification-design-test cycle at the heart of digital filter design. The result of repeated interactive graphical design sessions is that the designer can acquire a feel for how design parameters affect filter performance.
References
- S.K.Mitra, J. Kaiser, Handbook for Digital Signal Processing, 1993 John Wiley and Sons, Inc.
- J. Kodosky, J. McCrisken, G. Rymar, Visual Programming Using Structured Dataflow, Proceedings of 1991 IEEE Workshop on Visual Languages, October 8-11, 1991/Kobe, Japan.
- R. Jamal, L. Wenzel, The Applicability of the Visual Programming Language LabVIEW to Large Real-World Applications, Proceedings of 1995 IEEE Symposium on Visual Languages, September 4-8, 1995/Darmstadt, Germany.
- J. Kodosky, E. Perez, Linear Systems in LabVIEW, National Instruments Application Note 08, January 1991.
- National Instruments, LabVIEW Digital Filter Design Toolkit User Manual.
Reader Comments | Submit a comment »
Legal
'via Blog this'
No comments:
Post a Comment