How Can Virtual Memory Help with Memory Issues in LabVIEW? - National Instruments:
'via Blog this'
Friday 31 August 2012
Why do I get "Memory is Full" Error in LabVIEW? - National Instruments
Why do I get "Memory is Full" Error in LabVIEW? - National Instruments:
Solution:
This behavior occurs in several different occastions which are listed below. Typically, it appears when dealing with very large data sets in LabVIEW. LabVIEW stores arrays, clusters, and waveforms in contiguous blocks of memory. The most common reason for this error is that LabVIEW cannot allocate a contiguous block of memory large enough for one of your arrays. For example, a 2000x2000 array of doubles would occupy approximately 32 MB. You may have more than 32 MB of memory free, but it may not be in a contiguous block. For reasons to solve this issue as well as reducing other memory consumers, please read the following suggestions below:
Reduce Memory use of Arrays, Clusters, and Waveforms:
'via Blog this'
Solution:
This behavior occurs in several different occastions which are listed below. Typically, it appears when dealing with very large data sets in LabVIEW. LabVIEW stores arrays, clusters, and waveforms in contiguous blocks of memory. The most common reason for this error is that LabVIEW cannot allocate a contiguous block of memory large enough for one of your arrays. For example, a 2000x2000 array of doubles would occupy approximately 32 MB. You may have more than 32 MB of memory free, but it may not be in a contiguous block. For reasons to solve this issue as well as reducing other memory consumers, please read the following suggestions below:
Reduce Memory use of Arrays, Clusters, and Waveforms:
- Use a smaller data type for your array. For example, if you only need to store integers in the range of 0 to 100, you can change the integer representation to U8, which would use 1/8 of the memory as compared to a double, which is the default type for numeric controls.
- In LabVIEW 8.5 and later, use the In Place Element Structure to access elements in an array, cluster, or waveform without create copies of the data type in memory.
- If the problem is isolated to graphing the data, there may a simpler approach. With a large array, you probably cannot see every data point when you plot it to a graph (you may have more data points than you have pixels on your screen). In this case, decimating the data would be appropriate for display purposes (for example, plotting every other point).
- Stream/write your data to disk, then perform analysis of your large datasets from disk in a high-performance analysis and reporting package such as NI DIAdem.
- Limit the number of times data is copied by reducing the number of global and local variables, indicators. This can be done by using producer and consumer loops and using references to data through the VIs named New Data Value Reference.
- Create SubVIs in order to break up the code into smaller pieces so LabVIEW can reclaim subVI memory when subVIs are not executing.
- With Larger subVIs, use the call by reference node so that the VI is called dynamically. When the subVIs are called dynamically, they will not be brought into memory until they are called. This will allow LabVIEW to have more memory on hand to use for the rest of the application.
- You can perform further analysis of a VI's memory usage using the LabVIEW 2009 Help: Profile Performance and Memory Window.
- For more information about how to change your code to improve memory usage, please refer toKnowledgeBase 2T9ICKTL: How Can I Optimize the Memory Use in My LabVIEW VI?
- Increase the amount of virtual memory on your system. The following link provides more detail:KnowledgeBase 2U4A7R6I: How Can Virtual Memory Help With Memory Issues in LabVIEW?
- With Windows XP 32-bit, LabVIEW can only use 2GB of RAM. In order to increase how much memory it could use, there is a .ini file that can be changed. For more information on how to increase this, please follow the link to KnowledgeBase 2HDEH9DT: How Much Memory Can LabVIEW Use?
'via Blog this'
Tuesday 28 August 2012
Data Acquisition Reference Design for LabVIEW - Developer Zone - National Instruments
Data Acquisition Reference Design for LabVIEW - Developer Zone - National Instruments:
 If you have another process which requires lossless data transfer, you can use another queue to transfer data to it. This could be for signal processing or a data display for example.
 The Project Library also provides a very convenient method for creating a new version of the code to modify by using the “Save As…” feature to the save a copy of the Project Library to a new working directory.
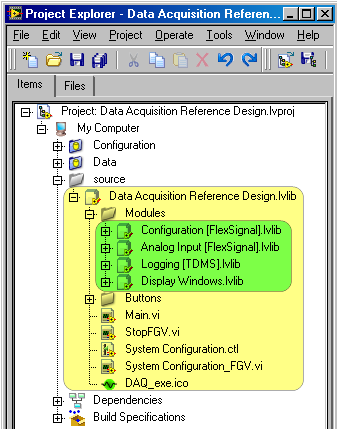 There can be a wide range of implementations for configuration from very simple to very complex. A good place to start is with the Queued Message Handler Template from AMC (http://zone.ni.com/devzone/cda/epd/p/id/6091#toc4).
Depending on the application requirements, signal processing can also be added to the Data Acquisition module or could be an entirely new module\process of its own.
Follow these recommended steps to add a new display window.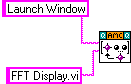
'via Blog this'
Overview
The Data Acquisition Reference Design provides a framework upon which you can build and expand a custom application. The reference design’s core functionality involves configuring data acquisition, acquiring data, logging data to disk, and displaying data. It is built on top of other LabVIEW software components in order to maximize software reuse. This is not designed to be a fully featured application, but rather a starting place for customization rather than a blank block diagram. To meet your needs, some customization will be required. The goal of this document is to explain the overall software design of the system.
Table of Contents
Software Architecture
The main software architecture consists of four primary processes as shown in Figure 1.
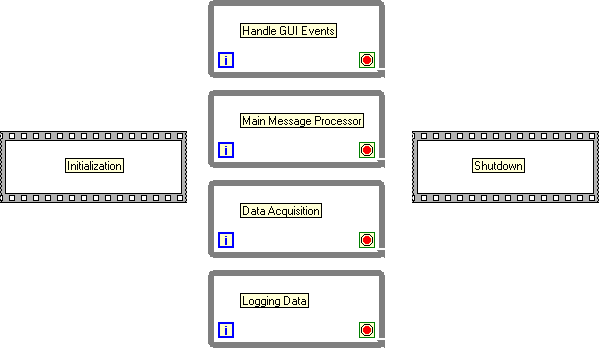
Figure 1 - Main Software Architecture
These processes perform the following tasks:
- Handle all GUI events from the main user interface.
- Process messages from user interaction or other external processes. Additional display windows or ‘plug-ins’ can be launched from this process.
- Acquire data continuously. Data is sent via a queue to the data logging process and is also published via a notifier for any display windows.
- Log data.
The messaging system between the different processes is based on the Asynchronous Message Communication (AMC) reference library.
There are two types of data that are passed between processes: commands and data. All of the commands are sent via AMC. Time domain data is sent over a lossless mechanism (queue) and a lossy mechanism (notifier). The design decision was made to guarantee delivery of data to the logging process while potentially sacrificing delivery to the display modules. If the PC has enough resources, both the queues and notifiers will perform in a lossless way. If the PC cannot handle what is being asked of it, the queue will buffer the data while the notifier will drop data. This data flow is shown below in Figure 2.
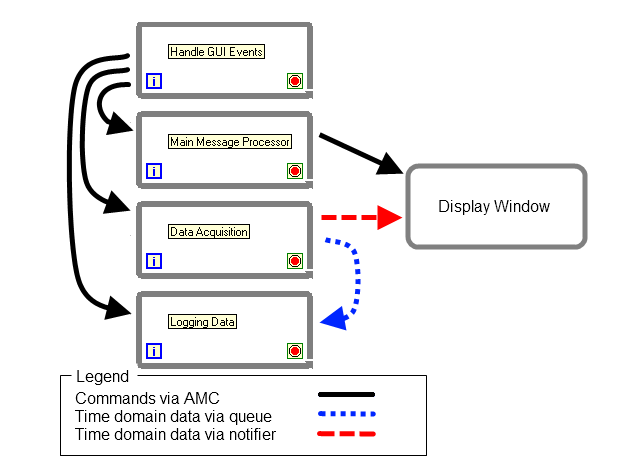
Figure 2 - Data flow between processes
Source Code Organization
The source code is organized into multiple Project Library (.lvlib) files. The top-level Project Library is named Data Acquisition Reference Design.lvlib (highlighted in yellow in Figure 3). This library contains the main application, system configuration VIs, buttons, and each of the specific modules. Each module is also a Project Library (highlighted in green in Figure 3). The use of the Project Libraries provides a good mechanism for protecting the namespace of the VIs, defining the scope of the VIs (public, private, etc.), and organizing the VIs. For more information on Project Libraries, refer to the Best Practices for Sharing and Reusing LabVIEW Code Developer Zone document.
Figure 3 - Project view of Data Acquisition Reference Design
Code Modules
This reference design has four code modules for each of the major functional pieces of the application. These modules are Configuration, Data Acquisition, Logging, and Display.
Configuration
The Configuration module’s purpose is to provide a way for the user to configure the system interactively. This could be through a front panel, loading saved configurations from file, or a configuration currently in memory. The decision of the specific implementation is up to the user and developer. Configuration is a very important piece of any application since there is typically lots of user interaction and it must strike a fine balance between features and usability.
Data Acquisition
The Data Acquisition module acquires data from the configured data source. This would typically be a hardware data acquisition device, but could also be data from a file or even simulated data. This module must be able to acquire data in a lossless fashion and send it to other processes for logging to disk, signal processing, or display.
The data acquisition process in the main application is a queue driven state machine (see Figure 4). A VI is used to receive messages generated by the user (such as pushing the Start button) and to progress the state machine appropriately. The state machine has four main states: Idle, Start, Acquire, and Stop.
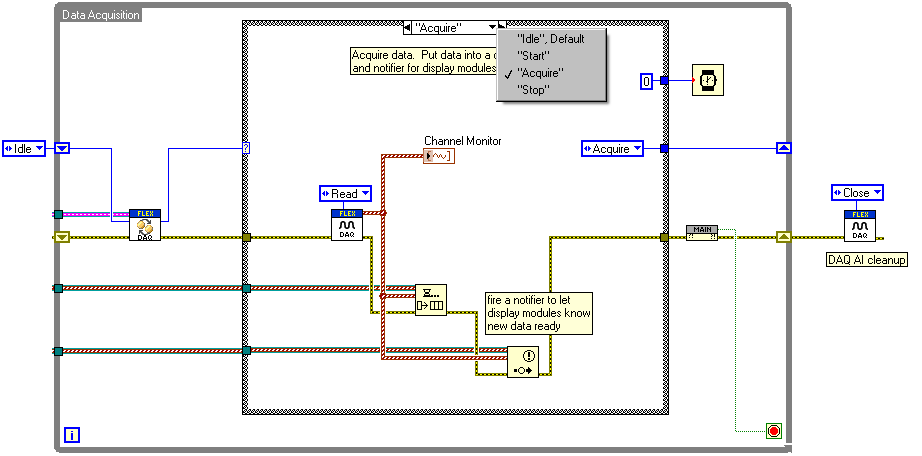
Figure 4 - Data acquisition process in main application
Data Logging
The Data Logging module saves time domain data to disk. The data is received from the data acquisition process via a queue. The queue is a buffered mechanism which guarantees that the data path is lossless, but if the data logging process cannot write data to disk fast enough, the buffer in the queue will continue to grow and use memory. Thought should be given on how to handle this situation such as some combination of limiting the queue size, monitoring the queue backlog, automatically stopping the acquisition and notifying the user.
The data logging process is also a queue driven state machine (see Figure 5). A VI is to receive messages generated by the user and dictate the next state for the state machine. The state machine consists of four states: Idle, Open File, Write to File and Close File.
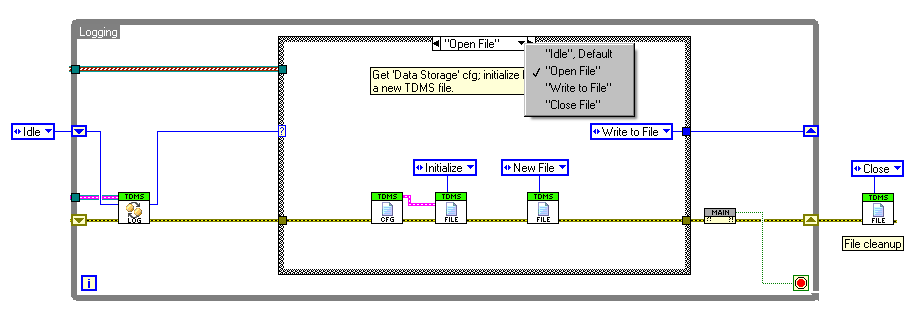
Figure 5 - Data logging process in main application
Display Windows
The display windows provide a way to get immediate feedback from the data as it is being acquired. The display windows are launched through VI Server in the Main Message Processor as reentrant VIs so that multiple windows of the same type kind can be viewed at the same time. The display VIs must be placed in a specific directory relative to the main application. The directory is <main>\Modules\Display.
The display windows are built from a VI template (see Figure 6). The Display Template.vit is based on the Queued State Machine template in AMC. Every time new data is received from the notifier, the Process Data state is executed. This is where any display code should be place such as channel selection or signal processing (FFT, RMS, etc). If it is important to the display, the data can be checked for continuity so the user is informed if the display is not continuous. This is particularly important to know in cases where signal processing like averaging or filtering is used across multiple data blocks.
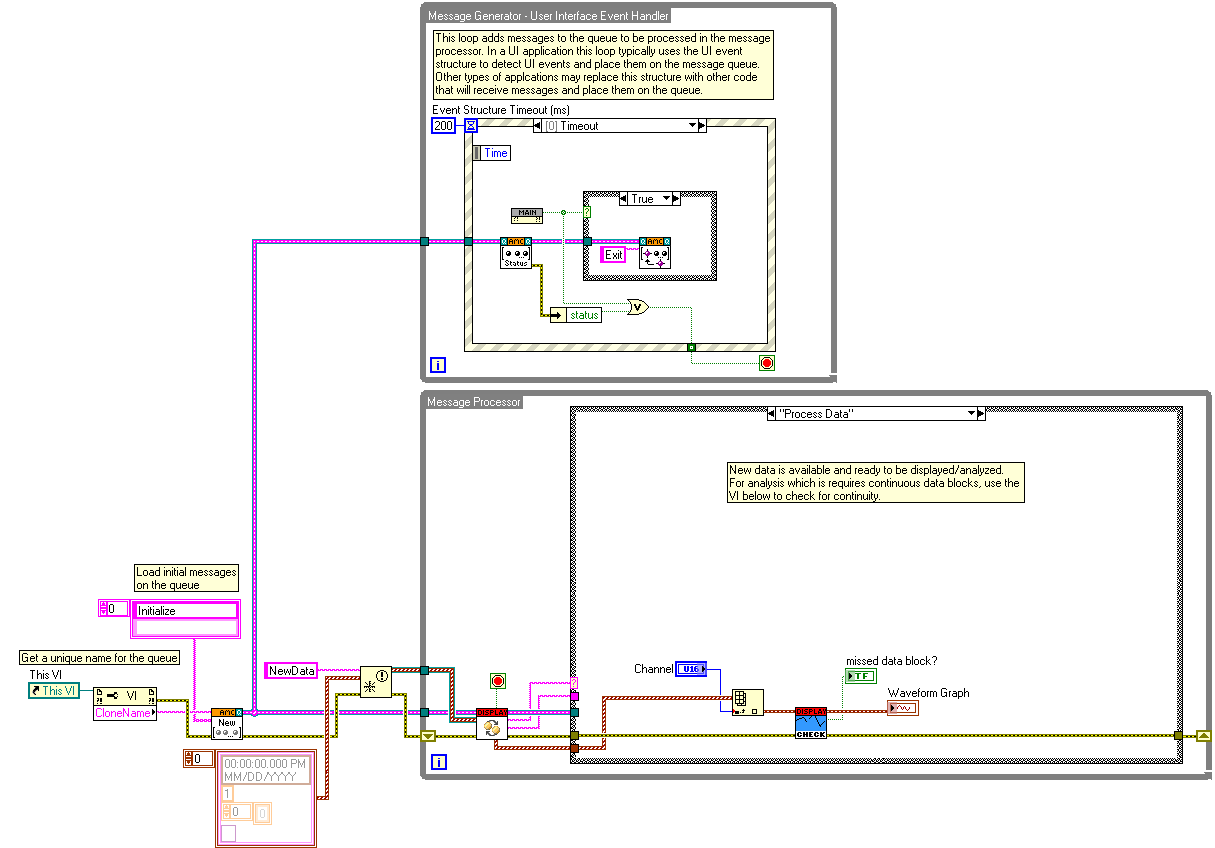
Figure 6 - Display window template block diagram
- Create a new display window VI.
- Right-click on Display Template.vit in the project and select “New from Template”.
- Modify the VI and save it to the <main>\Modules\Display directory.
- Add the VI to the Display Windows.lvlib.
- Create a button for the main application to launch the window.
- Add a “Value Change” event to the event structure for this new button.
- In this new event case, use AMC to send the “Launch Window” command with the new VI name as the data to the main message processor (see Figure 7).
Figure 7 - AMC command to launch FFT Display.vi
User Interface Techniques
Creating an application which is functionally powerful and intuitive at the same time can be very challenging. A lot of this challenge is in the design and implementation of the user interface (UI). Below is a list of different techniques for implementing the user interface in LabVIEW used in this application.
- Use a custom menu instead of the default LabVIEW menu. An example of this is in the NVH Channel Configuration.vi. This provides the user with only the options that apply to their specific application.
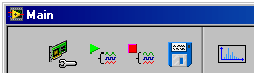
- Implement a simple toolbar. The main application has a simple toolbar (shown in Figure 3) implemented with customized system style buttons. Using glyphs with the buttons generally makes the user interface more intuitive and cleaner. Also, add tool tips to each button so the user can see a description of the button when it is hovered over.
Figure 8 - Toolbar of the main application
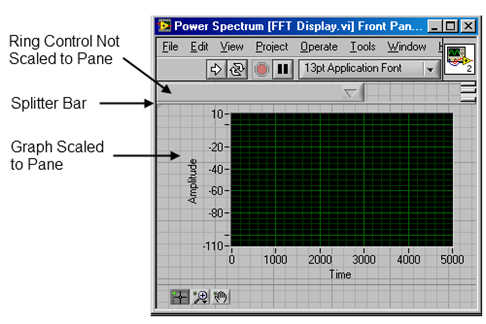
- Use splitter bars on front panel that can be resized. Splitter bars are a very useful tool when there is a portion of the front panel that needs be resized and another portion that doesn’t. An example of this common situation is in the FFT Display.vi. In this situation, the user is resizing the pane in order to get a better view of the graph so we don’t want to also resize the channel selector control as well. The front panel (see Figure 4) uses a splitter bar to divide it into two panes. The top pane consists of a ring control for channel selection that does not change size with the pane while the bottom pane has a graph which does scale to the pane size. To set a control to scale to the pane, right-click on it and select the “Scale Object with Pane” option.
Figure 9 - Splitter bar for front panel resizing
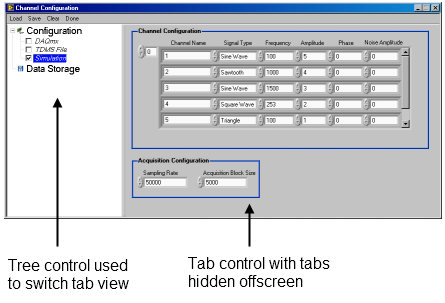
- Use tab controls and hide the tabs to give a more custom appearance. By hiding the tabs, another mechanism on the front panel can be used to switch between the different tabs. One example would be a toolbar on the left side of the front panel with different selections. In Channel Configuration.vi, a tree control is used to provide a more dynamic menu. When a different item is selected in the tree, the associated tab page is displayed. Programmatically changing the visible tab is very easy especially compared to doing something similar with subpanels. Another option is to make the tab itself transparent which makes the page names appear as text on the front panel. When the user clicks on the page name, that page appears.
Figure 10 - Hidden tabs
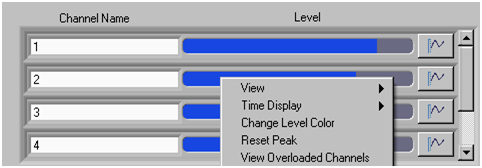
- Use XControls where appropriate. An XControl is a great way to encompass a custom user interface control that will be reused. The XControl provides addition customization options that aren’t available with standard controls and they help to keep the main VIs code cleaner by containing all of its code with the XControl. The main application uses the Channel Monitor XControl for quickly monitoring the status of the acquisition channels. Figure 6 shows the Channel Monitor XControl and some of the custom “right-click” options it has.
Figure 11 - Channel Monitor XControl
For more examples of UI techniques in LabVIEW, join the UI Interest Group on NI.com’s Community area: http://decibel.ni.com/content/groups/ui
LabVIEW Code
The link below contains more information about a specific implementation of this design along with the LabVIEW source code.
'via Blog this'
Sunday 26 August 2012
Saturday 25 August 2012
Subscribe to:
Posts (Atom)