Reference Library for Converting Between LabVIEW and XML Data (GXML) - Developer Zone - National Instruments:
'via Blog this'
Monday, 15 October 2012
Thursday, 11 October 2012
Wednesday, 10 October 2012
Debugging Techniques - LabVIEW 2011 Help - National Instruments
Debugging Techniques - LabVIEW 2011 Help - National Instruments:


'via Blog this'
Debugging Techniques
If a VI is not broken, but you get unexpected data, you can use several techniques to identify and correct problems with the VI or the block diagram data flow. If you cannot debug the VI using the following techniques, the VI might have a race condition.
 | Note To debug a stand-alone application or shared library, start by using these debugging techniques on the block diagram of the startup VI. |
(MathScript RT Module) If the VI contains a MathScript Node, use additional techniques to debug the script.
Execution Highlighting
View an animation of the execution of the block diagram by clicking the Highlight Execution button, shown as follows.
Execution highlighting shows the movement of data on the block diagram from one node to another using bubbles that move along the wires. Use execution highlighting in conjunction with single-stepping to see how data values move from node to node through a VI.
| Note Execution highlighting greatly reduces the speed at which the VI runs. |
If the error out cluster reports an error, the error value appears next to error out with a red border. If no error occurs, OKappears next to error out with a green border.
Single-Stepping
Single-step through a VI to view each action of the VI on the block diagram as the VI runs. The single-stepping buttons, shown as follows, affect execution only in a VI or subVI in single-step mode.
Enter single-step mode by clicking the Step Into or Step Over button on the block diagram toolbar. Move the cursor over theStep Into, Step Over, or Step Out button to view a tip strip that describes the next step if you click that button. You can single-step through subVIs or run them normally.
When you single-step through a VI, nodes blink to indicate they are ready to execute. If you single-step through a VI with execution highlighting on, an execution glyph, shown as follows, appears on the icons of the subVIs that are currently running.
Probe Tool
Use the Probe tool, shown as follows, to check intermediate values on a wire as a VI runs.
Use the Probe tool if you have a complicated block diagram with a series of operations, any one of which might return incorrect data. Use the Probe tool with execution highlighting, single-stepping, and breakpoints to determine if and where data is incorrect. If data is available, the probe immediately updates and displays the data in the Probe Watch Window during execution highlighting, single-stepping, or when you pause at a breakpoint. When execution pauses at a node because of single-stepping or a breakpoint, you also can probe the wire that just executed to see the value that flowed through that wire.
Types of Probes
You can check intermediate values on a wire when a VI runs by using a generic probe, by using an indicator on the Controlspalette to view the data, by using a supplied probe, by using a customized supplied probe, or by creating a new probe.
Generic
Use the generic probe to view the data that passes through a wire. Right-click a wire and select Custom Probe»Generic Probe from the shortcut menu to use the generic probe.
The generic probe displays the data. You cannot configure the generic probe to respond to the data.
LabVIEW displays the generic probe when you right-click a wire and select Probe, unless you already specified a custom or supplied probe for the data type.
You can debug a custom probe similar to a VI. However, a probe cannot probe its own block diagram, nor the block diagram of any of its subVIs. When debugging probes, use the generic probe.
Using Indicators to View Data
You also can use an indicator to view the data that passes through a wire. For example, if you view numeric data, you can use a chart within the probe to view the data. Right-click a wire, select Custom Probe»Controls from the shortcut menu, and select the indicator you want to use. You also can click the Select a Control icon on the Controls palette and select any custom control or type definition saved on the computer or in a shared directory on a server. LabVIEW treats type definitions as custom controls when you use them to view probed data.
If the data type of the indicator you select does not match the data type of the wire you right-clicked, LabVIEW does not place the indicator on the wire.
Supplied
Supplied probes are VIs that display comprehensive information about the data that passes through a wire. For example, the VI Refnum Probe returns information about the VI name, the VI path, and the hex value of the reference. You also can use a supplied probe to respond based on the data that flows through the wire. For example, use an Error probe on an error cluster to receive the status, code, source, and description of the error and specify if you want to set a conditional breakpoint if an error or warning occurs.
The supplied probes appear at the top of the Custom Probe shortcut menu. Right-click a wire and select Custom Probe from the shortcut menu to select a supplied probe. Only probes that match the data type of the wire you right-click appear on the shortcut menu.
Refer to the Using Supplied Probes VI in the labview\examples\general\probes.llb for an example of using supplied probes.
Custom
Use the Create New Probe dialog box to create a probe based on an existing probe or to create a new probe. Right-click a wire and select Custom Probe»New from the shortcut menu to display the Create New Probe dialog box. Create a probe when you want to have more control over how LabVIEW probes the data that flows through a wire. When you create a new probe, the data type of the probe matches the data type of the wire you right-clicked. If you want to edit the probe you created, you must open it from the directory where you saved it.
After you select a probe from the Custom Probe shortcut menu, navigate to it using the Select a Control palette option, or create a new probe using the Create New Probe dialog box, that probe becomes the default probe for that data type, and LabVIEW loads that probe when you right-click a wire and select Probe from the shortcut menu. LabVIEW only loads probes that exactly match the data type of the wire you right-click. That is, a double precision floating-point numeric probe cannot probe a 32-bit unsigned integer wire even though LabVIEW can convert the data.
| Note If you want a custom probe to be the default probe for a particular data type, save the probe in theuser.lib\_probes\default directory. Do not save probes in the vi.lib\_probes directory because LabVIEW overwrites those files when you upgrade or reinstall. |
Breakpoints
Use the Breakpoint tool, shown as follows, to place a breakpoint on a VI, node, or wire and pause execution at that location.
When you set a breakpoint on a wire, execution pauses after data passes through the wire and the Pause button appears red. Place a breakpoint on the block diagram to pause execution after all nodes on the block diagram execute. The block diagram border appears red and blinks to reflect the placement of a breakpoint.
When a VI pauses at a breakpoint, LabVIEW brings the block diagram to the front and uses a marquee to highlight the node, wire, or line of script that contains the breakpoint. When you move the cursor over an existing breakpoint, the black area of the Breakpoint tool cursor appears white.
When you reach a breakpoint during execution, the VI pauses and the Pause button appears red. Also, the VI background and border begin blinking. You can take the following actions:
- Single-step through execution using the single-stepping buttons.
- Check intermediate values on probes that you placed on wires prior to running the VI.
- Check intermediate values on probes that you place after running the VI if you have enabled the Retain Wire Values option.
- Change values of front panel controls.
- Check the Call list pull-down menu to see the list of VIs that call the VI that is stopped at a breakpoint.
- Click the Pause button to continue running to the next breakpoint or until the VI finishes running.
LabVIEW saves breakpoints with a VI, but they are active only when you run the VI. It can be useful to save a breakpoint for repeated use, instead of removing it and recreating it. However, you might not want all breakpoints to be active each time you run the VI. Disable breakpoints so execution does not pause at that breakpoint when you run the VI. You can use theBreakpoint Manager window to disable, enable, clear, or locate existing breakpoints. Open the Breakpoint Manager window by selecting View»Breakpoint Manager or by right-clicking an object on the block diagram and selectingBreakpoint»Breakpoint Manager from the shortcut menu.
You can remove breakpoints individually or throughout the entire VI hierarchy.
How LabVIEW Highlights Breakpoints
LabVIEW behaves differently in terms of how breakpoints are highlighted and when execution pauses dependent on where you have placed breakpoints on the block diagram. You can place breakpoints on structures, nodes, and wires.
Structure Breakpoint
The following illustration shows a For Loop with a breakpoint. The VI pauses before the entire For Loop finishes executing. A red border around the block diagram highlights the breakpoint. If the block diagram is inside a structure, the structure includes the red border. The pause in execution occurs when all nodes on the block diagram finish running. If a breakpoint is in a loop structure, the pause occurs after each loop iteration.
Node Breakpoint
The following illustration shows a breakpoint on the Increment node. The VI pauses before the Increment function runs. One wire also has a breakpoint. The VI pauses again after the Multiply function executes. A red border around the node highlights the breakpoint. The pause in execution occurs just before the node executes. You can probe all the input signals into the node with the Probe tool.
Wire Breakpoint
The following illustration shows a breakpoint on a wire with an attached probe. When you have selected Retain Wire Values and you place the cursor over a wire, a tip strip appears, as shown, that includes the value of the data in the wire. The pause in execution occurs after data pass through the wire and the probe displays the data from the current iteration. A red bullet in the middle of the wire highlights the breakpoint. If you attach a probe to the wire, the probe also has a red border.
Disabled Breakpoint
The following illustration shows breakpoints on the For Loop, Increment node, a wire, and (MathScript RT Module) a line of script in a MathScript Node. All breakpoints are disabled. The VI does not pause at any of the breakpoints. The red border around the block diagram objects is thinner than normal to indicate that you have disabled the breakpoint. If you enable the breakpoints, the red border returns to a thicker width, as shown in the previous illustrations.
Suspending Execution
Suspend execution of a subVI to edit values of controls and indicators, to control the number of times the subVI runs before returning to the caller, or to go back to the beginning of the execution of the subVI. You can cause all calls to a subVI to start with execution suspended, or you can suspend a specific call to a subVI.
To suspend all calls to a subVI, open the subVI and select Operate»Suspend when Called. The subVI automatically suspends when another VI calls it. If you select this menu item when single-stepping, the subVI does not suspend immediately. The subVI suspends when it is called.
To suspend a specific subVI call, right-click the subVI node on the block diagram and select SubVI Node Setup from the shortcut menu. Place a checkmark in the Suspend when called checkbox to suspend execution only at that instance of the subVI.
The VI Hierarchy window, which you display by selecting View»VI Hierarchy, indicates whether a VI is paused or suspended. An arrow glyph, shown as follows, indicates a VI that is running regularly or single-stepping.
A pause glyph, shown as follows, indicates a paused or suspended VI.
A green pause glyph, or a hollow glyph in black and white, indicates a VI that pauses when called. A red pause glyph, or a solid glyph in black and white, indicates a VI that is currently paused. An exclamation point glyph, shown as follows, indicates that the subVI is suspended.
A VI can be suspended and paused at the same time.
Determining the Current Instance of a SubVI
When you pause a subVI, the Call list pull-down menu on the toolbar lists the chain of callers from the top-level VI down to the subVI. This list is not the same list you see when you select Browse»This VI's Callers, which lists all calling VIs regardless of whether they are currently running. Use the Call list menu to determine the current instance of the subVI if the block diagram contains more than one instance. When you select a VI from the Call list menu, its block diagram opens and LabVIEW highlights the current instance of the subVI.
You also can use the Call Chain function to view the chain of callers from the current VI to the top-level VI.
Debugging Sections of Block Diagrams
You can run a VI with a section of the block diagram disabled, similar to commenting out a section of code in a text-based programming language. Disable a section of the block diagram to determine if the VI performs better without it. Place the section you want to disable inside a Diagram Disable structure.
You also can debug a section of code to isolate the problem. To debug a section of code, place the code you want to debug inside a Conditional Disable structure.
Instrumentation
If a probe, breakpoint, or execution highlighting takes a long time to debug the code of a VI, create an instrumentation VI. Use an instrumentation VI to observe the execution of a VI and debug the problem.
Program the instrumentation VI to read data from a VI you want to debug and to generate a report with the results. In the instrumentation VI, specify the section of code you want to debug, point to a path to the VI you want to debug, and include a time step.
An instrumentation VI works similarly to the Desktop Execution Trace Toolkit because both tools provide you with the execution order of data in a block diagram.
'via Blog this'
Monday, 8 October 2012
Boost Productivity with Quick Drop - Developer Zone - National Instruments
Boost Productivity with Quick Drop - Developer Zone - National Instruments:

'via Blog this'
NI LabVIEW palettes contain hundreds of useful VIs and functions, but, when you know the exact VI you need, navigating through the palette can take too much time. Quick Drop lets you rapidly find and place LabVIEW front panel and block diagram objects without navigating the palettes or initiating a search.
Table of Contents
- Video of Quick Drop in Action
- Background
- How Quick Drop Works
- Tips and Tricks for Using Quick Drop
- Summary
- Learn More about LabVIEW 2009
Video of Quick Drop in Action
This video demonstrates the use of Quick Drop to quickly find and place objects on the block diagram of a LabVIEW VI. Playback is at actual speed.
Background
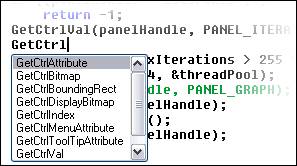
Finding the correct function or snippet of code can be challenging in any language. Text-based development environments depend on proper syntax, but many modern development environments help by automatically completing partially typed functions using predictive text.
Figure 1. NI LabWindows™/CVI software automatically generates a list of matching items for partially completed functions.
While the LabVIEW graphical development environment has always required a computer mouse to place and position objects, Quick Drop now helps you quickly navigate to the correct VI with a few simple keystrokes before placing the item with the mouse.
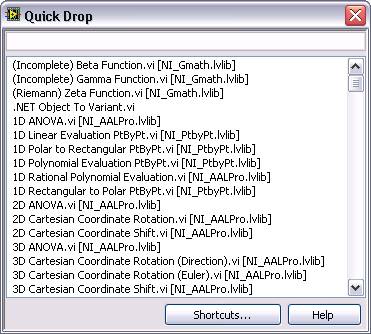
To begin using Quick Drop, press CTRL and Space. The dialog that appears contains a list of all the VIs in the palettes.
Figure 2. Press CTRL + Space to show the Quick Drop dialog.
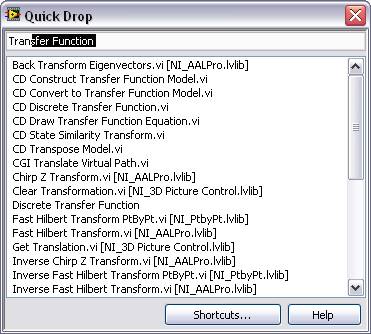
You can filter the list by typing a phrase from the title of the VI you need. Quick Drop shortens the list as you type to display items with names containing your entered text. Quick Drop also applies predictive text to your query using the first VI in the palette that begins with the same letters.
In the Figure 3 example, the user has typed “t-r-a-n.” LabVIEW attempts to automatically predict the name of the object using the first matching entry. The filtered list shows candidates that contain “t-r-a-n” somewhere in the name.
Figure 3. Quick Drop automatically completes queries with the first VI that begins with the same letters and shows all other possible matches in the list.
Quick Drop automatically places the highlighted item on the mouse cursor so you can type the name of a function and click once on the block diagram or front panel to place the object. If Quick Drop cannot predict your search, you can select the correct item from the list of matching results.
Keyboard Shortcuts Accelerate Programming
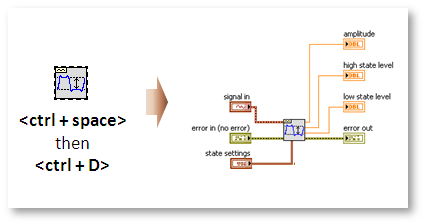
Several new keyboard shortcuts have been added to Quick Drop in LabVIEW 2009 that speed programming even more. The first shortcut automatically generates all controls and indicators for a selected VI, eliminating the time it would have taken to place these objects. Select the VI then open Quick Drop (<ctrl + space>) and then press <ctrl + D>. Use <ctrl + shift + d> instead to automatically place all input constants for the selected VI.
Figure 4. Select a VI, then press <ctrl + space> to open Quick Drop. Once the window appears press <ctrl + D> to automatically place and wire all controls and indicators for the selected VI.
Removing an unwanted VI in an application often requires you to rewire all tunneling wires like errors or references. Save time by pressing <ctrl + R> after selecting a VI and opening Quick Drop to remove a VI and connect input and output wires in place of that VI.
Figure 5. Select a VI, then press <ctrl + space> to open Quick Drop. Once the window appears press <ctrl + R> to delete the selected VI and connect corresponding input and output wires.
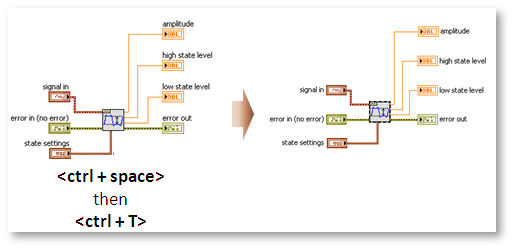
Some LabVIEW programmers prefer their labels on the left of input and right of outputs, and changing those positions can take time. Automate the process by pressing <ctrl + T> with Quick Drop open to move labels from the top of controls, indicators, and constants on a selected VI to the sides.
Figure 6. Select a VI, then press <ctrl + space> to open Quick Drop. Once the window appears press <ctrl + T> move object labels from above to the sides of objects.
Create Your Own Keyboard Shortcuts
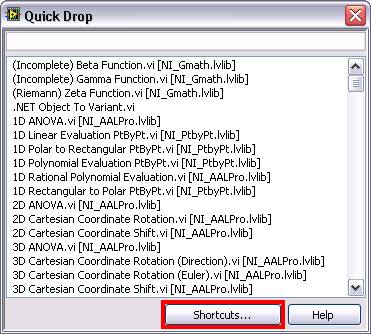
You can also configure shortcuts within Quick Drop to help access the VIs you use frequently without scrolling through results by clicking on the “Shortcuts” button from the Quick Drop dialog.
Figure 7. Click the “Shortcuts” button to define custom shortcuts for your most commonly used palette items.
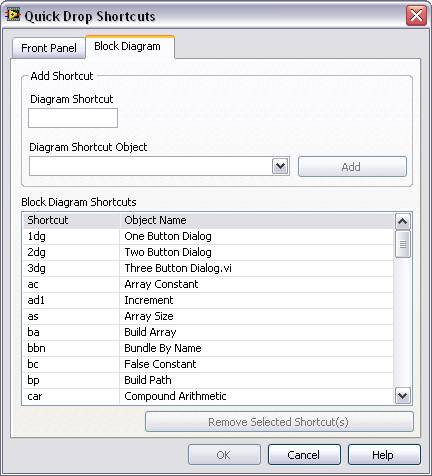
You can make complicated VI names or VIs that share the first part of a name with other VIs more readily available by linking them to a two- or three-letter shortcut. It is recommended that you use letters that you can easily reach with your nondominant hand to keep your dominant hand on the mouse.
Figure 8. Try to define shortcuts using two or three letters.
LabVIEW stores your configured shortcuts in the LabVIEW.ini file. Copy and paste the value of QuickDropDiagramShortcuts and QuickDropPanelShortcuts into the LabVIEW.ini file to transfer them to another installation. Find an example list of shortcuts below or copy the key value from below:
- ad1 = increment
- cs = case structure
- evstr = event structure
- fs = for loop
- wat = wait
- ws = while loop
To add a set of common shortcuts, copy the following text into the LabVIEW.ini file:
QuickDropDiagramShortcuts="1dg:One Button Dialog;2dg:Two Button Dialog;3dg:Three Button Dialog.vi;ac:Array Constant;ad1:Increment;as:Array Size;ba:Build Array;bbn:Bundle By Name;bc:False Constant;bp:Build Path;car:Compound Arithmetic;cbr:Call By Reference Node;ccat:Concatenate Strings;cr:Close Reference;cs:Case Structure;cstr:Concatenate Strings;cv:Current VI's Path;dds:Diagram Disable Structure;dfa:Delete From Array;ea:Empty Array?;eq:Equal?;estr:Empty String/Path?;estrc:Empty String Constant;evstr:Event Structure;fs:For Loop;fss:Flat Sequence Structure;fstr:Format Into String;g0:Greater Than 0?;geq:Greater Or Equal?;geq0:Greater Or Equal To 0?;gr:Greater?;mp:Match Pattern;mul:Multiply;nan:Not A Number/Path/Refnum?;nc:Numeric Constant;ndx:Index Array;neq:Not Equal?;nes:In Place Element Structure;nv:Invoke Node;ovr:Open VI Reference;ras:Replace Array Subset;rn:Property Node;s1d:Search 1D Array;sav:Select a VI...;sb1:Decrement;sc:String Constant;se:Select;sp:Strip Path;sss:Search/Split String;tc:Tick Count (ms);tmsc:To More Specific Class;ubn:Unbundle By Name;vtd:Variant To Data;wat:Wait (ms);ws:While Loop;"
QuickDropPanelShortcuts="bool:Push Button;ei:Error In 3D.ctl;eo:Error Out 3D.ctl;led:Round LED;nc:Numeric Control;nnd:Numeric Indicator;sac:Select a Control...;scan:System Cancel Button;sctr:String Control;smc:System Multicolumn Listbox;snd:String Indicator;sok:System Button;syscan:System Cancel Button;systb:System Table;"
If you are a new developer, you still need palettes to find required functionality by drilling into the appropriate category. However, as you become more familiar with LabVIEW and function names, Quick Drop gives you the ability to place the desired VI without navigating palettes. This is valuable for improving productivity as the default palettes grow with installed modules and additional functionality.
To learn more about new LabVIEW 2009 features, visit the LabVIEW 2009 portal at ni.com.
Download LabVIEW to use the latest features.
The mark LabWindows is used under a license from Microsoft Corporation. Windows is a registered trademark of Microsoft Corporation in the United States and other countries.
'via Blog this'
Sunday, 7 October 2012
Developer Walkthrough of the Finite Measurement Sample Project - Webcasts and Videos - Developer Zone - National Instruments - National Instruments
Developer Walkthrough of the Finite Measurement Sample Project - Webcasts and Videos - Developer Zone - National Instruments - National Instruments:
'via Blog this'
Developer Walkthrough of the Finite Measurement Sample Project
Overview
The Finite Measurement sample project acquires a single measurement and provides options for exporting the measurement to file. This sample project is designed as a state machine that can respond to user requests to configure and run a measurement, perform analysis, display results, and log data to disk.
| View Now (watch) 8 minute(s) demo Requires: Adobe Flash Please disable your browser's pop-up blocker to view this content. |
'via Blog this'
Finite Measurement Sample Project Documentation - Developer Zone - National Instruments
Finite Measurement Sample Project Documentation - Developer Zone - National Instruments:
'via Blog this'
Table of Contents
- Developer Walkthrough
- System Requirements
- Use Cases
- Running this Sample Project
- Customizing this Sample Project
- Important Information
The Finite Measurement sample project acquires a finite measurement and provides options for exporting the measurement to disk. This sample project is designed as a state machine that can perform the following actions:
- Initializing hardware and the user interface (Initialize state)
- Handling user interactions (Wait for Event state)
- Updating the user interface (Update UI state)
- Configuring the application (Configure state)
- Acquiring data from hardware (Acquire state)
- Loading data from a .lvm file (Load Data state)
- Saving data to a .lvm file (Save Data state)
- Exporting data to a tab-delimited text file (Export Data state)
- Clearing data from the graph (Clear Data state)
- Applying custom analysis to the data (Analyze state)
- Copying an image of the graph to the clipboard (Copy Graph state)
- Stopping the application and saving your settings to disk (Stop state)
This sample project is based on the Simple State Machine template. Refer to the Simple State Machine template and its documentation, available from the Create Project dialog box, for information about how this template works.
Developer Walkthrough
See a developer walkthrough of the Finite Measurement template.
System Requirements
LabVIEW Base, Full, or Professional Development System. This sample project is designed for use with NI-DAQmx, an instrument driver, or other driver software.
Use Cases
The Finite Measurement sample project is designed for an instantaneous measurement application; that is, an application that provides separate options for the user to acquire data, log it, export it, and otherwise execute one action at a time.
Running this Sample Project
- In the Project Explorer window, open and run Main.vi.
- Click Acquire. The program simulates an instantaneous acquisition of data.
- Click the other front panel buttons to explore the sample project.
Customizing this Sample Project
- To add data acquisition code, complete the following steps:
- Add hardware refnums to HW Configuration.ctl. For example, you could add DAQ task references here.
- Modify Acquire Data from Hardware.vi to initialize the hardware device and acquire data using the refnum you added. For example, you could use the DAQ Assistant or Instrument I/O Assistant.
- To modify how this application saves and loads data, modify Save Data.vi and Load Data.vi. For example, you could modify these VIs to save and load from a binary file instead of a .lvm file.
- To modify how this application analyzes acquired data, modify Statistical Analysis.vi.
- To modify how this application exports data, modify Export Data.vi. For example, you could export the data to a CSV or XML file instead of a tab-delimited file.
- To modify how this application copies the graph to the clipboard, modify Copy Graph to Clipboard.vi. For example, you could copy the image as an EPS file or save the image directly to disk instead of copying a BMP file to the clipboard.
Important Information
Copyright
© 2012 National Instruments. All rights reserved.
Under the copyright laws, this publication may not be reproduced or transmitted in any form, electronic or mechanical, including photocopying, recording, storing in an information retrieval system, or translating, in whole or in part, without the prior written consent of National Instruments Corporation.
National Instruments respects the intellectual property of others, and we ask our users to do the same. NI software is protected by copyright and other intellectual property laws. Where NI software may be used to reproduce software or other materials belonging to others, you may use NI software only to reproduce materials that you may reproduce in accordance with the terms of any applicable license or other legal restriction.
End-User License Agreements and Third-Party Legal Notices
You can find end-user license agreements (EULAs) and third-party legal notices in the following locations:
- Notices are located in the <National Instruments>\_Legal Information and <National Instruments> directories.
- EULAs are located in the <National Instruments>\Shared\MDF\Legal\license directory.
- Review <National Instruments>\_Legal Information.txt for information on including legal information in installers built with NI products.
Trademarks
LabVIEW, National Instruments, NI, ni.com, the National Instruments corporate logo, and the Eagle logo are trademarks of National Instruments Corporation. Refer to the Trademark Information at ni.com/trademarks for other National Instruments trademarks.
Other product and company names mentioned herein are trademarks or trade names of their respective companies.
Patents
For patents covering the National Instruments products/technology, refer to the appropriate location: Help»Patents in your software, the patents.txt file on your media, or the National Instruments Patent Notice at ni.com/patents.
'via Blog this'
Simple State Machine Template Documentation - Developer Zone - National Instruments
Simple State Machine Template Documentation - Developer Zone - National Instruments:
'via Blog this'
Overview
The Simple State Machine template facilitates defining the execution sequence for sections of code. This particular implementation often is referred to as a Moore machine, which determines the next state based on decisions made in the current state. The design of this template makes it easy to insert new sections of code, remove sections of code, or change the order in which sections execute – all without making major modifications to the structure of the application.
Table of Contents
- Example
- Developer Walkthrough
- System Requirements
- Use Cases
- Overview
- Running This Template
- Modifying this Template
- Important Information
Example
Refer to the Single Shot Measurement sample project, available from the Create Project dialog box, for an example of adapting this template to a measurement application.
Developer Walkthrough
See a developer walkthrough of the Simple State Machine template.
System Requirements
LabVIEW Base, Full, or Professional Development System
Use Cases
This template is suitable for applications that can be described as a combination of:
- States
- Decision-making logic that determines when to move to a particular state
For example, the following applications can benefit from the state machine pattern:
- Single-page or tabbed dialog boxes. Each tab of the dialog box corresponds to a state. A user initiates state transitions by clicking a particular tab. For each tab, any actions the user can perform are included in the state.
- An automated teller machine (ATM). The states in this application might include waiting for user input, checking the requested amount against the account balance, dispensing the money, printing the receipt, and so on.
- An application that takes one measurement, logs it to disk, and then waits for another user action. The states in this application might include waiting for user input, performing the measurement, logging the data, displaying the data, and so on.
Overview
Notes:
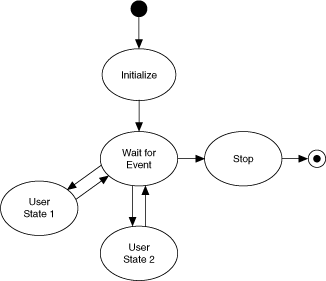
- Each state in the diagram above corresponds to a subdiagram of the Case structure in Main.vi. Each state:
- Performs some action
- Tells the state machine what the next state is by passing an instruction to a shift register on the While Loop.
- After initialization, the state machine transitions to the Wait for Event state. This state contains an Event structure that waits for front panel changes. When a user clicks a button, LabVIEW recognizes the event and switches to the appropriate subdiagram of the Event structure. This subdiagram initiates a transition to the appropriate state.
- Each state has access to a cluster of data. The data types in this cluster are defined in Data.ctl.
- The valid states are listed in State.ctl, which is a typedef. Using a typedef for state transitions restricts the transitions you can use, reducing the chances that the state machine gets into an unrecognized state.
- Only the Stop state can stop the application. This design prevents accidental and partial shutdowns by guaranteeing that:
- Shutdown code runs only when the user wants to stop the application.
- Shutdown code always runs to completion.
- Only one state executes at a time, and the single While Loop means all tasks execute at a single rate. If you need multi-rate or parallel tasks, consider the Queued Message Handler or Actor Framework templates, available from the Create Project dialog box.
- The Wait for Event state is the only one that recognizes user input. The state machine must be in this state for any user input to be accepted.
Running This Template
- In the Project Explorer window, open and run Main.vi.
- Click the front panel controls to display different pop-up dialog boxes.
Modifying this Template
Determining Your Needs
Before you customize this template, ask yourself the following questions:
- What states does the application consist of? The answer to this question determines the states you add.
- For each state, what should the next state be? The answer to this question determines the value of the Next State enum that each state sends to the shift register on the While Loop.
A single state can conditionally transfer to multiple states. An example is the Wait for Event state in the template, which transitions to a state based on user input. - What kind of data will each state need access to? The answer to this question determines what data types you add to Data.ctl.
- What are some errors that could occur, and how should the application respond to these errors? The answers to these questions determine the amount of error handling you need.
Adding Initialization Code
Complete the following steps to add code that initializes your application:
- Locate the Initialize subdiagram of the Case structure.
- Add code that initializes your application. For example, you may want to open a file on disk for logging, initialize the data in Data.ctl to specific values, and so on.
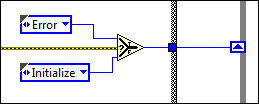
- Decide what state the application should transition to. By default, the Initialize state transitions to the Wait for Event state:
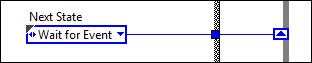
Depending on the needs of your application, you can modify this code to transition to a different state.
Adding a Control that Initiates a State Transition
- Add a control to the front panel.
- Locate the Wait for Event subdiagram of the Case structure.
- Add an event case to the Event structure.
- Configure the event to trigger when the value of this new control changes. For example:
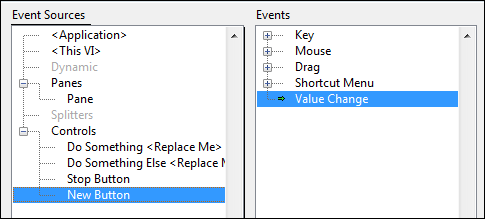
- Click OK. LabVIEW creates a subdiagram in the Event structure.
- Drag the block diagram terminal for the new control inside this subdiagram.
- Decide what state you want to transition to as a result of the user interacting with this control and wire an enum with this state's value to the Next State output tunnel:
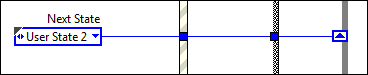
If the state you want to transition to does not exist, add it.
Adding a State
Complete the following steps to add a state:
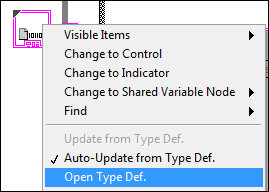
- Update States.ctl, the typedef that contains the valid states:
- Locate an enum of States.ctl and open the typedef:
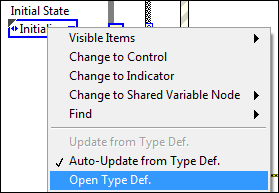
LabVIEW displays the Control Editor window. - Add a space for the new state to the States enum.
- Enter the name of the new state. For example:
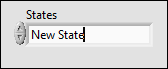
- Click outside the control to add the name to the list of states.
- Select File»Apply Changes.
- Locate an enum of States.ctl and open the typedef:
- Add the state to the state machine itself:
- Add a subdiagram to the Case structure in Main.vi.
- Add code that the state will execute. As you do this, pay attention to the following guidelines:
- Use the Unbundle by Name and Bundle by Name functions to access and modify state data:
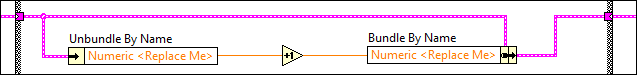 [+] Enlarge Image
 - Wire the error terminals of your functions to the error shift register.
- Wire a FALSE constant to the Boolean output tunnel. Only the Stop state can stop the loop.
- Each state must specify a transition to another state. Wire the value of the next state to the Next State output tunnel. You can wire this terminal directly, or you can implement conditional logic. The following figure shows an example of such logic:
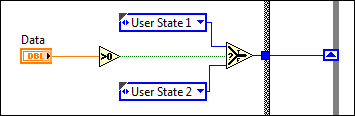
In the code shown above, if Data is greater than 0, User State 1 is the next state. Otherwise, User State 2 is the next state. For more advanced conditional logic, use a Case structure. - Ensure the application contains a transition to the new state.
- Use the Unbundle by Name and Bundle by Name functions to access and modify state data:
Modifying the Data Types that States can Access
Complete the following steps to modify the data types that states have access to:
- Locate an enum of Data.ctl and open the typedef:
LabVIEW displays the Control Editor window. - Customize the control to your needs.
- Select File»Apply Changes.
Adding Shutdown Code
Add shutdown code to the Stop subdiagram of the Case structure. Because the this subdiagram is the only one that can stop the application, any code you add to this subdiagram is guaranteed to execute before the application stops and not at any other time. This design prevents accidental and partial shutdowns.
Shutdown code commonly accomplishes the following tasks:
- Frees memory by closing any open references.
- Flushes any buffers in use.
- Writes safe values to hardware input channels
Adding Error Handling
By default, this template stops if any function returns an error on its error out terminal. You might want to ignore specific errors or implement some more intelligent error handling. Complete the following steps to add error handling:
- Add an Error state.
- In the Error state, create the code that handles errors in the ways you want.
- In all other states, transition to the Error state whenever an error occurs. For example:
Removing the User Interface
If your application does not need a user interface, complete the following steps to remove it:
- Delete all front panel controls and indicators.
- Delete the Wait for Event subdiagram from the Case structure in Main.vi.
- The previous step removes the Default subdiagram, which is the subdiagram that executes when the Case selector is told to execute to an unknown subdiagram. For error-handling purposes, make another subdiagram the default.
- Fix any broken wires.
You also can remove Wait for Event from State.ctl. This step ensures that your state machine can never attempt to transition to the state you just removed. However, before you do this, make a note of the enums in your application that call this state. After you save the updated State.ctl, these enums will change. Ensure the new, changed state is what you want.
'via Blog this'
Controlling Timing in LabVIEW Applications (ETS, VxWorks, Windows) - LabVIEW 2012 Help - National Instruments
Controlling Timing in LabVIEW Applications (ETS, VxWorks, Windows) - LabVIEW 2012 Help - National Instruments:
'via Blog this'
Controlling Timing in LabVIEW Applications (ETS, VxWorks, Windows)
Use timed structures to monitor and control the timing of your code. Timed structures work best with real-time applications and advanced Windows applications. For other applications, consider using the following objects instead of timed structures. These objects provide you with slightly less control over the timing of your code but require less configuration than timed structures.
- While Loop
- Wait (ms) function
- Wait Until Next ms Multiple function
- Other loops and structures in LabVIEW
Determining Which Timed Structure to Use
If you decide timed structures are appropriate for your application, the following information can help you decide which timed structure to use.
| Timed Structure | Purpose of the Structure | Execution |
|---|---|---|
| Timed Loop | Timed Loops work well for:
| Executes code repeatedly until a stop condition is met. |
| Timed Loop with Frames | Timed Loops with frames work well for:
| Executes code repeatedly, in sequence, until a stop condition is met. A Timed Loop with frames behaves like a Timed Loop that contains an embeddedSequence structure. |
| Timed Sequence | Timed Sequence structures work well for:
| Executes code in sequence only once. Unlike Timed Loops, Timed Sequence structures do not repeat iterations. |
'via Blog this'
Subscribe to:
Comments (Atom)